Assessment · 4 min read
Inside an Endurance Assessment Report: An Illustrative Walkthrough
A useful endurance report should help you understand the measurements and decide what to do in training. This walkthrough uses fictional figures from DVOTION’s demonstration profile. It shows the relationship between results, interpretation and a practical next step; it is not a client case study or a prediction of your results.
By DVOTION Team ·
Illustrative report
From a result to a training decision.
Fictional running data. These figures are not client results or targets for your training.
Endurance Performance Profiling
Example only- VO₂ max
- 58.4 ml/kg/min
- First lactate threshold
- 146 bpm
- Second lactate threshold
- 172 bpm
Separate maximal test
5:13 /km at LT1
4:07 /km at LT2
Example samples joined for readability. The line does not calculate LT1 or LT2; threshold interpretation requires the full assessment.
View the example measurements
| Speed, km/h | Heart rate, bpm | Lactate, mmol/L |
|---|---|---|
| 9 | 128 | 1.0 |
| 10.5 | 139 | 1.4 |
| 12 | 152 | 2.0 |
| 13.5 | 164 | 3.1 |
| 15 | 175 | 5.0 |
| 16.5 | 185 | 8.2 |
What the example shows
LT1 is reported at 146 bpm and LT2 at 172 bpm. Gas analysis gives VT1 at 149 bpm and VT2 at 170 bpm. The two methods provide related, distinct findings.
What to discuss
Easy runs at 152 bpm would sit above this example’s LT1. Discuss an agreed easy running range below 146 bpm, using perceived effort and conditions alongside heart rate.
What to review
Check whether the next block’s easy sessions achieve their intended purpose. Compare future assessments using the same exercise mode and a comparable protocol.
Begin with what was assessed
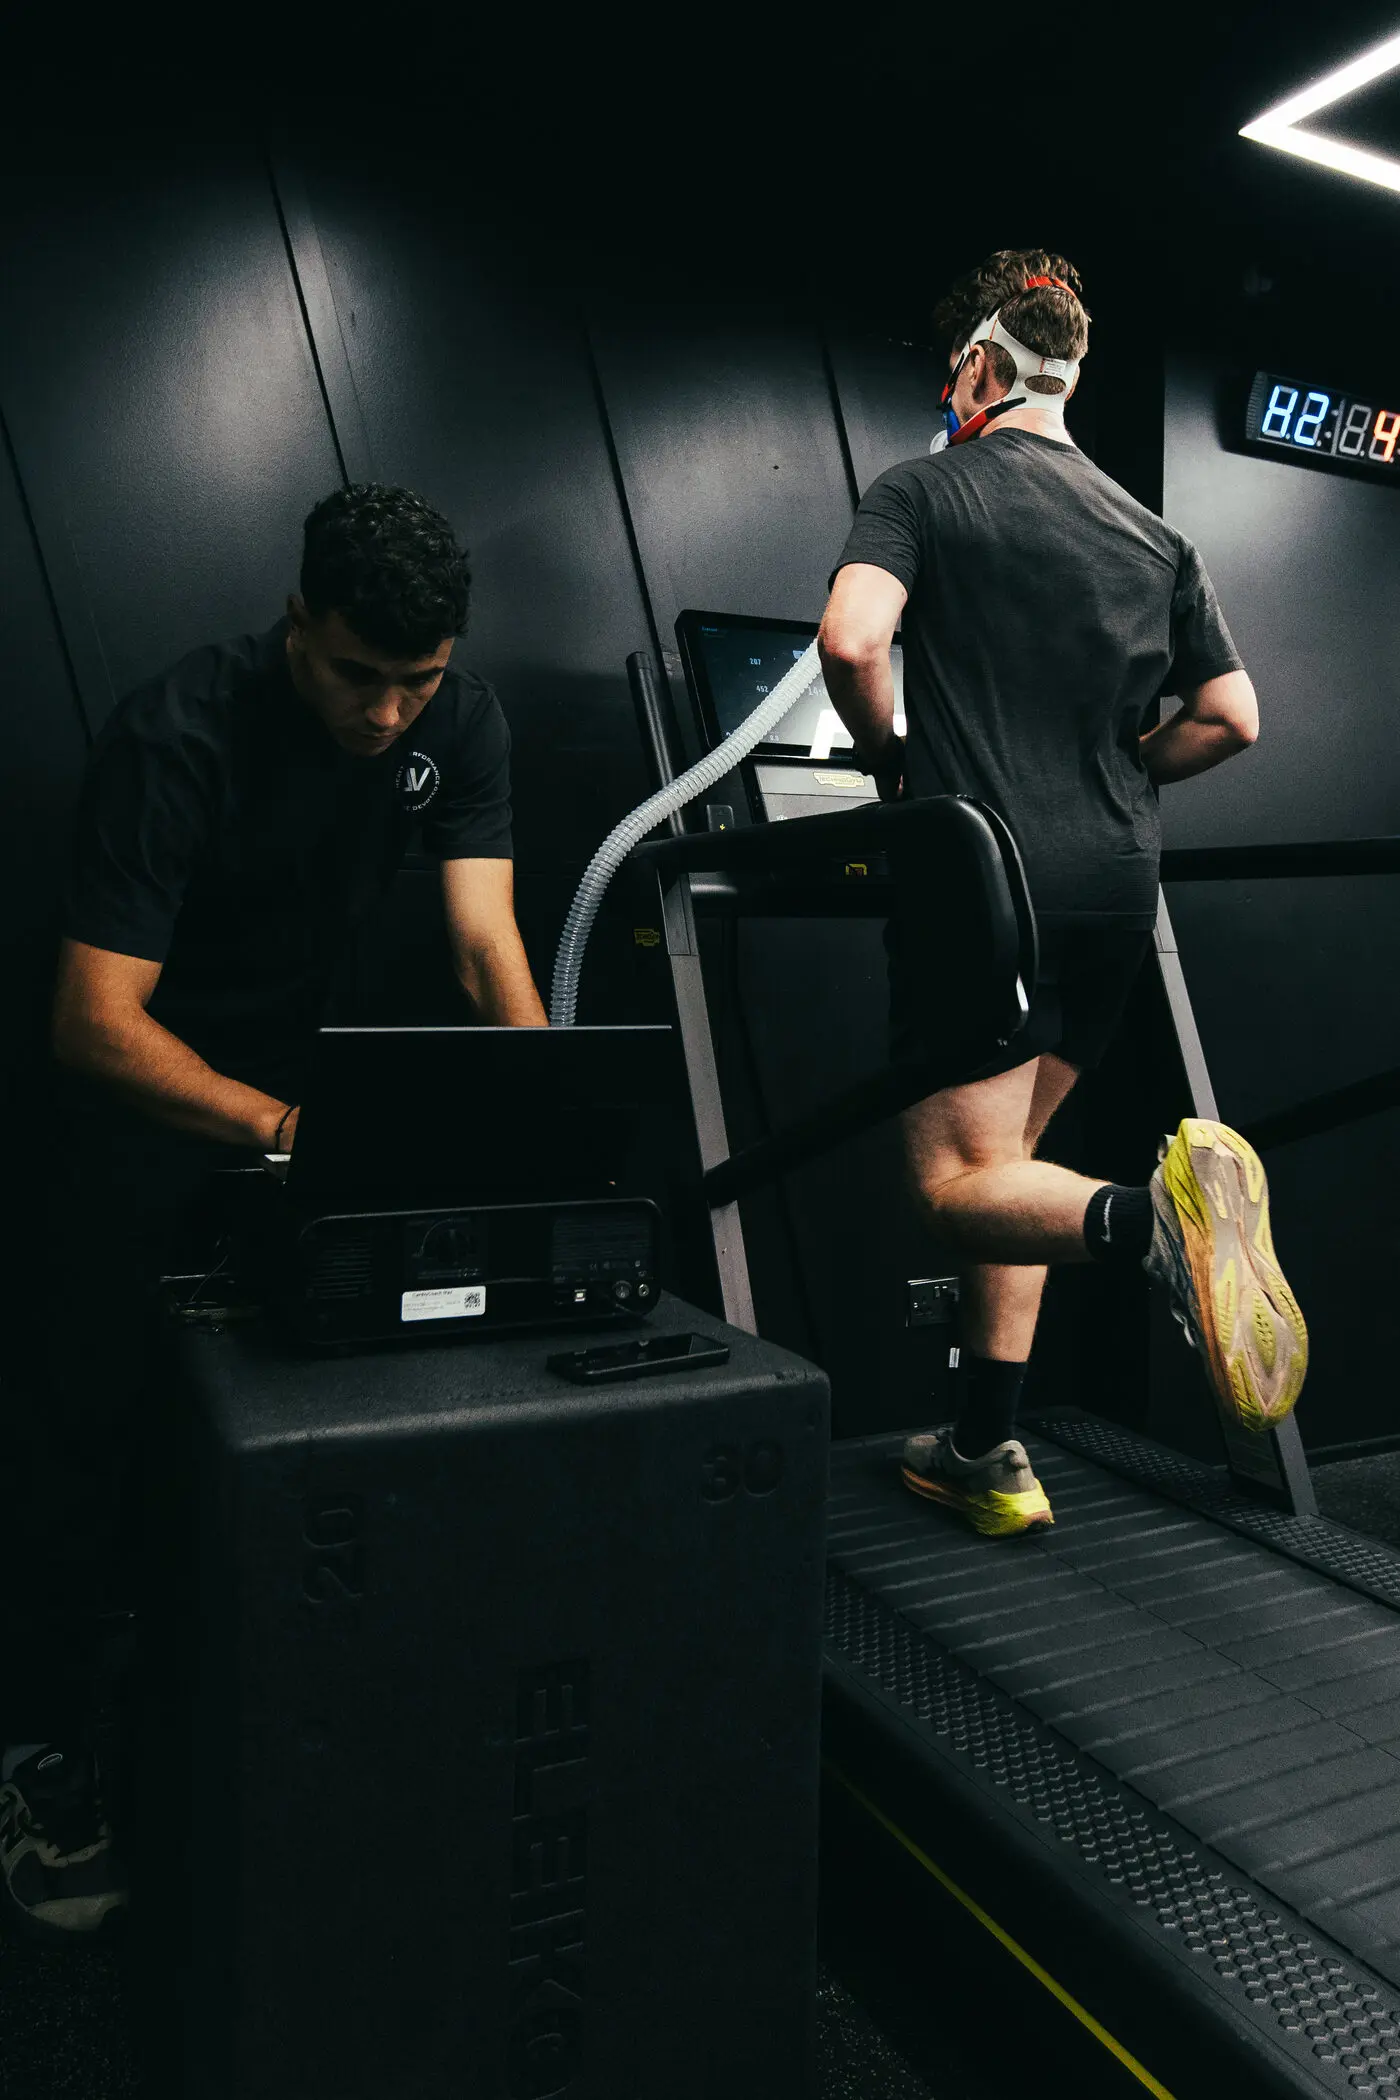
The example below represents running Endurance Performance Profiling: a progressive blood lactate profile followed, after recovery, by a separate maximal aerobic test. It brings the two sets of findings together without treating them as the same measurement.
A real report should be read alongside the exercise mode, protocol, preparation and observations from the appointment. Those details help explain whether a comparison with a previous test is fair.
Read the thresholds before building a training week
LT1 and LT2 are interpreted from the blood lactate response. The corresponding heart rate and pace give context for prescribing running sessions. The example’s ventilatory thresholds come from gas analysis and sit close to, but do not exactly match, the lactate thresholds.
VO₂ max describes maximum oxygen uptake during the aerobic test. It is a different part of the profile from the intensity the athlete can sustain. One value should not replace the rest of the discussion.
Connect a finding to an observable change
In this fictional example, easy runs have been around 152 bpm, above the reported LT1 of 146 bpm. The proposed discussion is whether to keep the next block’s easy running within an agreed range below LT1 and review how those sessions feel.
That is an example of reasoning from a profile, not a training prescription for someone reading this page. Your own ranges and programme should come from your assessment, goals and training context.
Keep the limits visible
The figures shown are illustrative. The curve displays example samples, while the threshold values represent an example interpretation; the graph is not an automatic threshold calculator. A real interpretation needs the full protocol and response.
The walkthrough is an explanation of report content, rather than a downloadable client PDF or a complete training plan. Resting metabolic rate and sweat measurements are separate assessments and are not implied to be included in Endurance Performance Profiling.
Frequently asked questions
Are the figures in this DVOTION report example from a real client?
No. Every result in this walkthrough is fictional demonstration data. It illustrates how findings can be explained and does not represent a testimonial or promised outcome.
Does Endurance Performance Profiling include RMR testing?
No. Resting metabolic rate is a separate assessment. Endurance Performance Profiling includes a blood lactate profile and a separate maximal aerobic test.
Can I copy the example report’s heart rate zones?
No. The example values are fictional and belong to the demonstration profile. Use your own assessment and training context when agreeing training ranges.
References
- Jamnick NA, Pettitt RW, Granata C, Pyne DB, Bishop DJ (2020). An examination and critique of current methods to determine exercise intensity. Sports Medicine 50(10): 1729–1756. doi:10.1007/s40279-020-01322-8
Supports: Physiological thresholds depend on the measurement and interpretation method. The figures in this walkthrough are fictional, not study findings.
Related assessment
Endurance Performance Profiling