Force Plate Assessment · London
Force & Power Profile
Measure how you produce force and power, and identify which physical qualities should be targeted in your training.
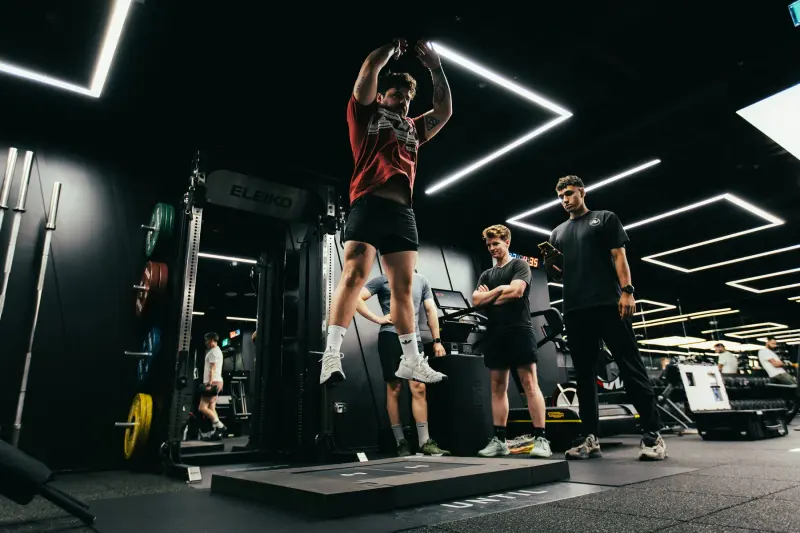
Jump height or peak power only shows the final outcome. Hawkin Dynamics force plates allow us to measure what happens throughout the movement, including how you brake, how you transition into propulsion, the impulse you produce, your velocity and the contribution of each limb.
On the day
How it works.
01
Brief intake
Your sport, its demands, training history and goals. The same force-time curve means different things for a 10km runner and a sprinter, so the context comes before the data.
02
Force plate protocols
Selected for you from countermovement jumps, reactive and repeated jumps, drop jumps and isometric holds on the Hawkin Dynamics plates. Results are on screen as you go.
03
Results and report
What you produced, how long you had to produce it, and the strategy you used to get there, then what that means for your training.
Equipment
Hawkin Dynamics Force Plates
Wireless dual-plate system sampling at 1000Hz, 1,000 data points per second. Used by professional sports clubs and national team programmes. The same standard used by elite testing centres worldwide.
Sample rate
1000Hz
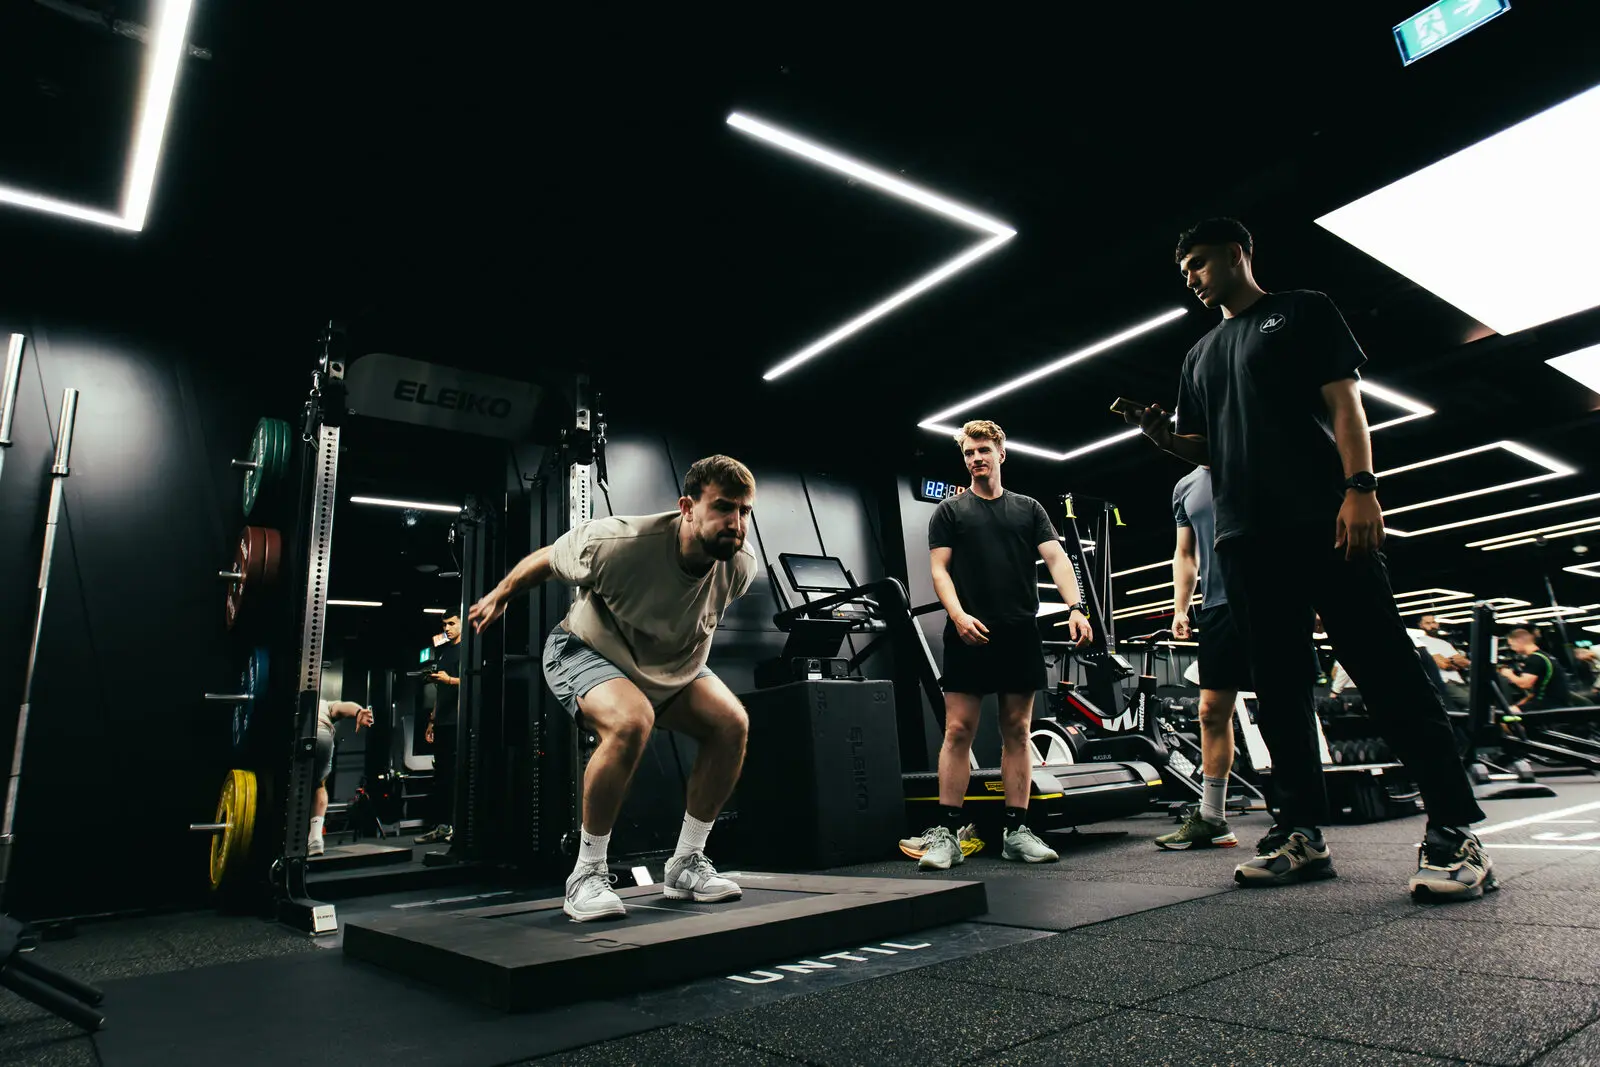
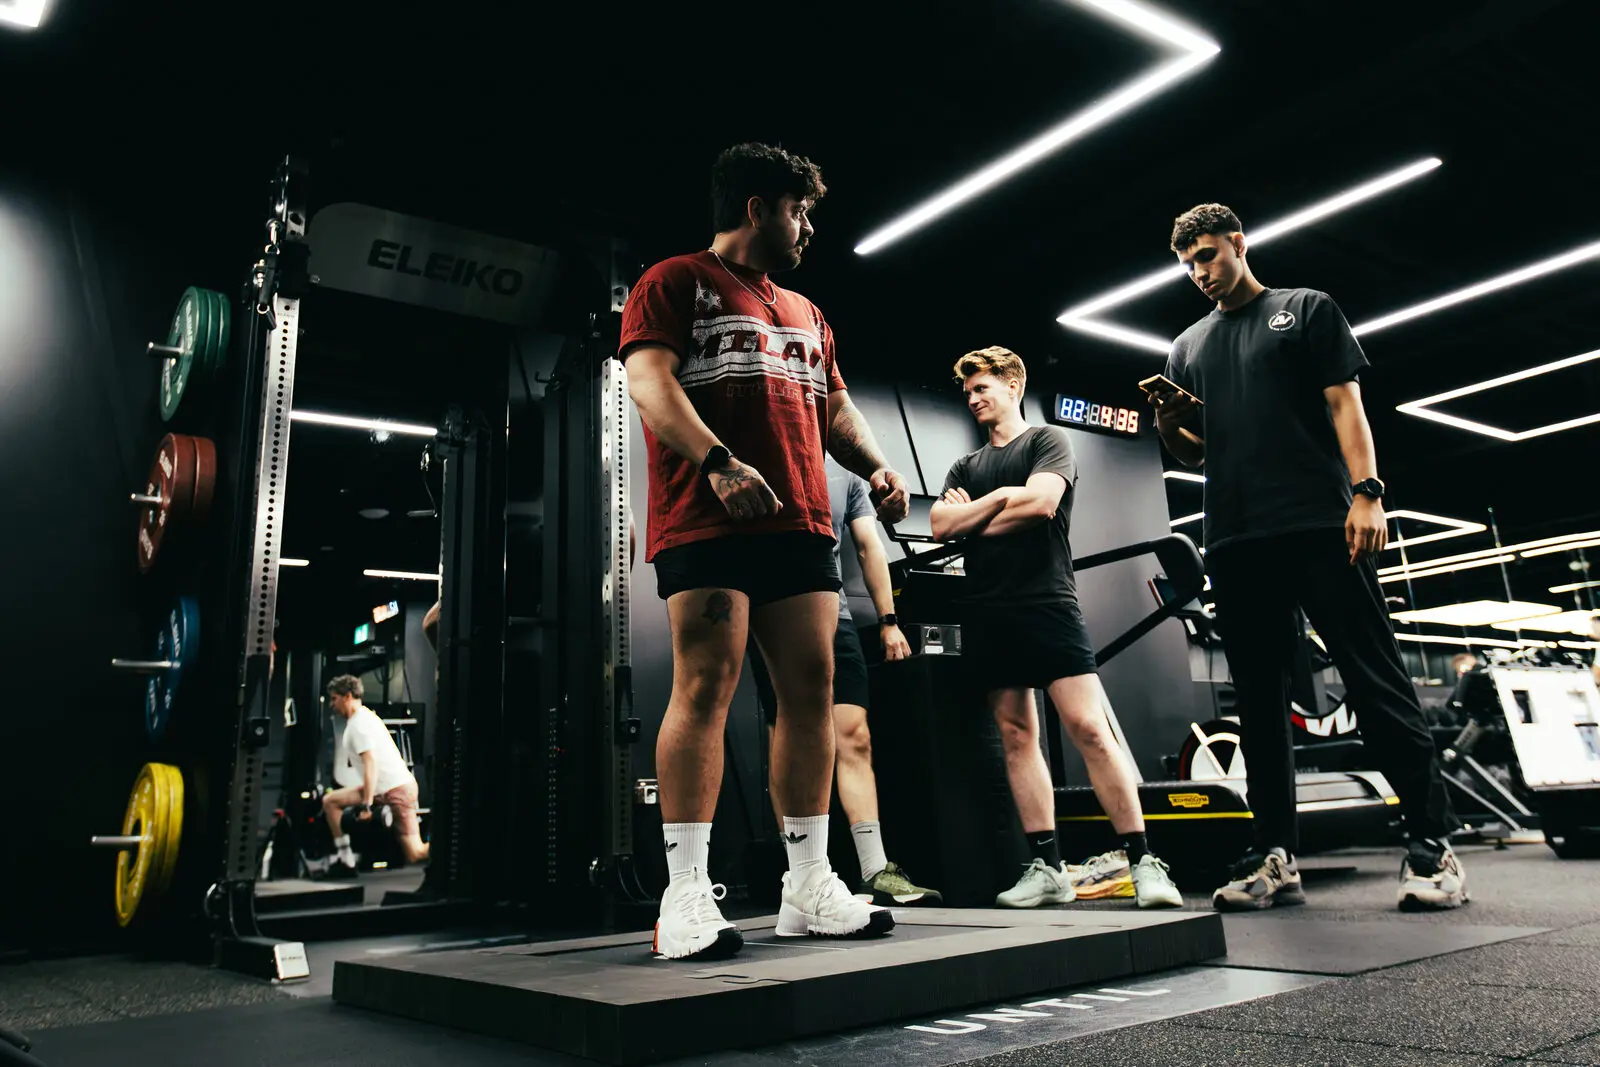

Braking, propulsion, impulse and limb contribution.
This allows us to distinguish between athletes who may achieve a similar outcome through different force production strategies. Your results can then be used to determine whether qualities such as force production, braking or producing force quickly should receive greater emphasis within your strength and power training.
01Braking and the transition into propulsionHow you absorb force, and how quickly you turn it around.
How we measure it
Countermovement depth and duration, braking force and impulse, and the time taken to move from absorbing force into producing it.
Why it matters
Two athletes can jump the same height by entirely different routes, one by sinking deep and taking their time, one by reversing quickly from a shallow position. Which route you take is what determines whether the strategy suits your sport.
02Force, impulse and timeNot just how much force, but how long you needed to build it.
How we measure it
Peak and mean force, impulse, time to take-off and rate of force development, absolute and relative to body weight.
Why it matters
Force with unlimited time is a different quality from force under a time constraint. A sport with short ground contacts rewards the second, and a high peak force reached slowly may not reach the ground before the contact is over.
03Velocity and powerHow well force is converted into movement.
How we measure it
Peak and mean velocity, peak power, and reactive strength where the protocol includes repeated or drop jumps.
Why it matters
Shows where the current limit sits (in producing force, or in expressing it fast enough to matter), which is what decides whether the next block leans towards strength or towards speed.
04What each limb contributedSide-to-side contribution, phase by phase.
How we measure it
Each limb’s share of braking and propulsion across the protocols, rather than a single whole-test figure.
Why it matters
A difference is a finding, not a fault. Reviews of the published work find left-right differences in strength are the ones most often linked to reduced jumping and cycling performance. Results for other qualities are mixed. What makes a number mean anything is context, whether it shows up across protocols, and how it changes over time.
05Your reportThe numbers, the strategy behind them, and what follows.
How we measure it
Every metric above with your force-time curves, read against your sport and your goals.
Why it matters
Results are on screen during the session; the written report follows. A strategy is never called efficient or inefficient without saying what it is being judged against.
Investment
£150
1 hour · Available now
UNTIL Liverpool Street and UNTIL Marylebone, London.
What you get
Written report
All force plate metrics explained (peak power, RFD, asymmetry, DSI and RSImod) in a document you keep.
Real-time results on the day
Every jump and hold displayed live. Your results and what they mean explained before you leave.
Training direction
Clear prioritisation (whether you need strength, plyometric work or load management) based on your data.
FAQs
Common questions.
How you produce force when the time available to produce it is limited. A jump takes a fraction of a second, so it forces you to organise yourself quickly, and the force plates record what that organisation looked like. You get the outcome, the time you had to reach it, and the mechanical route you took: how deep and how long the countermovement was, how quickly you turned braking into propulsion, how force built through the movement, and what each limb contributed.
Force plate testing measures force production; Biomechanical Assessment examines movement strategy. The Biomechanical Assessment establishes what movement options are available to you and which strategy you tend to rely on. The Force & Power Profile shows how that strategy appears when you have to produce an outcome quickly. This assessment measures the expression; it does not establish the strategy in isolation.
Yes. Force plate testing is useful for anyone who trains with intent: a club runner, a HYROX competitor, a team-sport player. What changes with level is the interpretation, not whether the measurement is worth having.
Not on its own. Some degree of difference is normal, and it can reflect a strategy that suits your sport rather than a problem to correct. What makes a difference worth attention is whether it shows up consistently across protocols, whether it fits your history and sport, and whether it is changing over time. This is a performance assessment: it does not diagnose an injury and it cannot predict one.
It depends on you, your sport and your goals. It may include countermovement jumps, reactive strength testing, repeated jumps and isometric force testing. It is a short battery of maximal efforts with rest between them: a measurement protocol, not a fitness test, and you will not be jumping to exhaustion.
That depends on what you are asking the result to do. A strategy that produces a large amount of force when there is enough time to build it may suit one sport and be poorly matched to another that demands rapid force production, repeated contacts or short ground contact times. A number is not good or bad until it is placed against your event.
Hawkin Dynamics force plates, a wireless dual-plate system sampling at 1000Hz, so each limb is recorded separately a thousand times a second. The same equipment used by professional clubs and national programmes.
The Force & Power Profile costs £150 at DVOTION Labs in London. Allow 1 hour for the appointment, including setup, testing and a discussion of your results. A written report explains the findings and recommendations for your training.
DVOTION Labs offers force plate testing at UNTIL Liverpool Street, 280 Bishops Square, London EC2M 4RB, and UNTIL Marylebone, 1 Orchard Street, London W1H 6HJ. Both locations operate by appointment.
Repeat force plate testing when the result can inform your next training decision, such as after a strength or plyometric block. Use the same protocols and similar preparation so that changes can be interpreted alongside normal variation. Your practitioner can help choose an interval that suits the training you are doing.
Yes. If the findings suggest a fuller understanding of your movement options would be useful, you can move up to the Movement & Force Production Strategy Assessment for a further £250, the same £400 as booking the two together. We will only raise it when the results point that way.
- Duration
- 1 hour
- Price
- £150
- Locations
- Liverpool Street · Marylebone
- Equipment
- Hawkin Dynamics force plates
- Format
- 1:1, jump and isometric force protocols
Who this is for
- Athletes in sports decided by how quickly force can be produced, not only how much
- Anyone who wants their force-time profile measured rather than inferred from the weight room
- Athletes tracking what a strength or plyometric block changed
- Anyone wanting an objective baseline before committing to a fuller assessment
- Team-sport athletes comparing braking and propulsion across limbs
Who it isn't for
- Anyone wanting to establish their movement strategy — that is the Biomechanical Assessment, and this assessment does not replace it
- Anyone looking for a training programme rather than measurement and direction
- Anyone seeking a clinical opinion; this is a performance assessment and does not diagnose injury
Practitioners
Practitioners running your session.

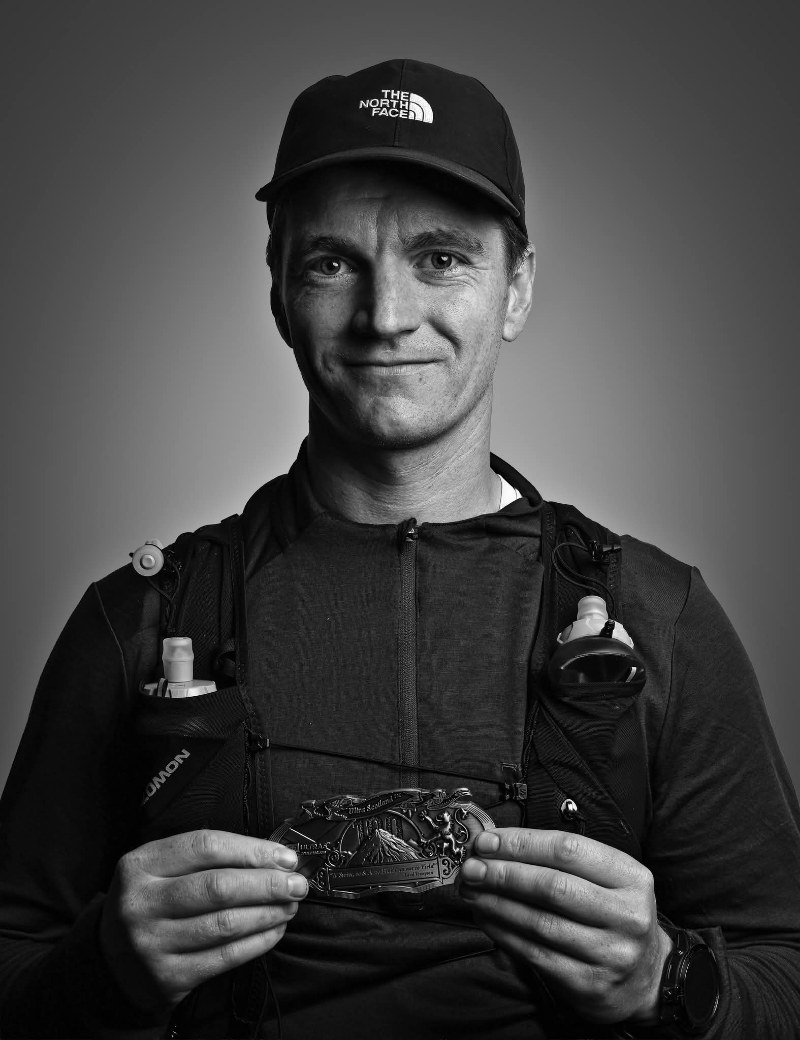
Founder & Head Coach
Health & Performance Coach
Book your Force Plate Assessment.
Measure your force and jump performance, compare left and right contributions, and discuss the findings with your coach.
Book Force Plate Assessment